In Part 1 I looked at the “accusations” by Steven Goddard that GISS had changed the historical temperature records several times since 1980. I showed that his major error was simply ignoring the changes in the baselines in the different years. The baseline for the oldest graph was 1880-1890, newer used 1951-1980.
In an attempt to see where this came from, I tried to find the origin of the rumours. The oldest I could find is on the site of Steve McIntyre, in Februari 2007.From the comments it can be deduced that he made the same error in the baselines, but later corrected it. Not completely, so his final graph is still a bit incorrect [1].
I found more data – using links on the same site -, completing the picture in this way. The baseline I used is still from the original 1880-1980 period. As can be seen – until 1995 there very small changes only. Then there are slightly bigger changes, but nothing really undermining the overall picture.
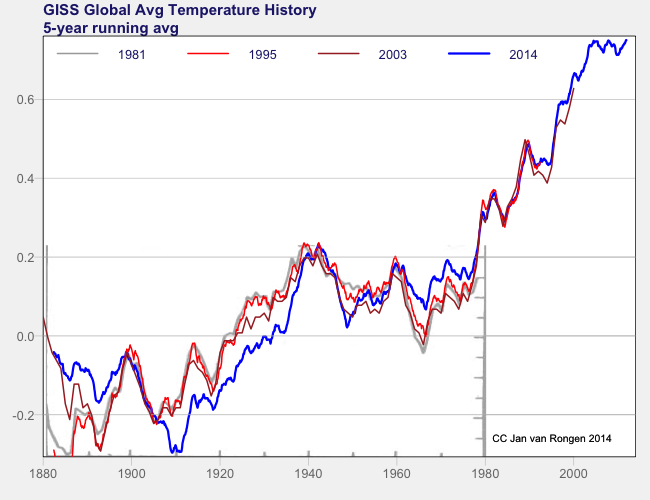
The changes between the red and the brown line were made around 2000. They are documented in a report from NOAA, GISS and HAD (Hansen ea 2001), so this really was a combined effort between the different agencies that produce these time series. The biggest change came after 2003 – that might have to do with the introduction of a new version of the raw data from GCHN in 2011. The 2003 data were the last I was able to found on the internet waybackmachine.
There are sceptics and sceptics. The ones that remain scientists all state: there is no tampering of these records, the changes are well documented improvements. Steve Goddard has got it all wrong, say Steve McIntyre [1], Julia from The Blackboard[3], and Judith Curry[2].
What you see here is science making progress, slowly.
[1] compare my figure with the second on this page http://climateaudit.org/2007/02/23/hansen-then-and-now/
[2] http://judithcurry.com/2014/07/07/understanding-adjustments-to-temperature-data/, http://judithcurry.com/2014/06/28/skeptical-of-skeptics-is-steve-goddard-right/
[3] http://rankexploits.com/musings/2014/how-not-to-calculate-temperature/
Another view of the same data
A nice book on time series is by Jonathan D. Cryer & Kung-Sik Chan, Time Series Analysis
With Applications in R (2008, Springer, 2nd Edition). They recommend using a large window to view charts, in R under Windows that would be
win.graph(width=15, height=10,pointsize=16)
although in Rstudio one can also use the zoom button for plots. I use a Mac in the living room and Windows upstair in the study, so I am using Rstudio. Anyway, I opened this graph in a large window:
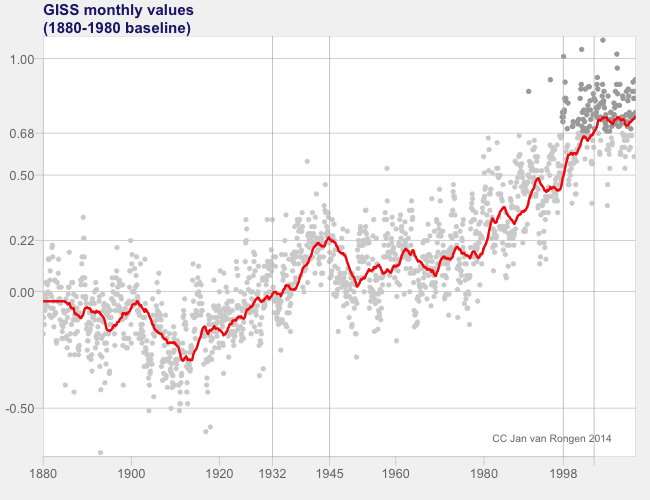
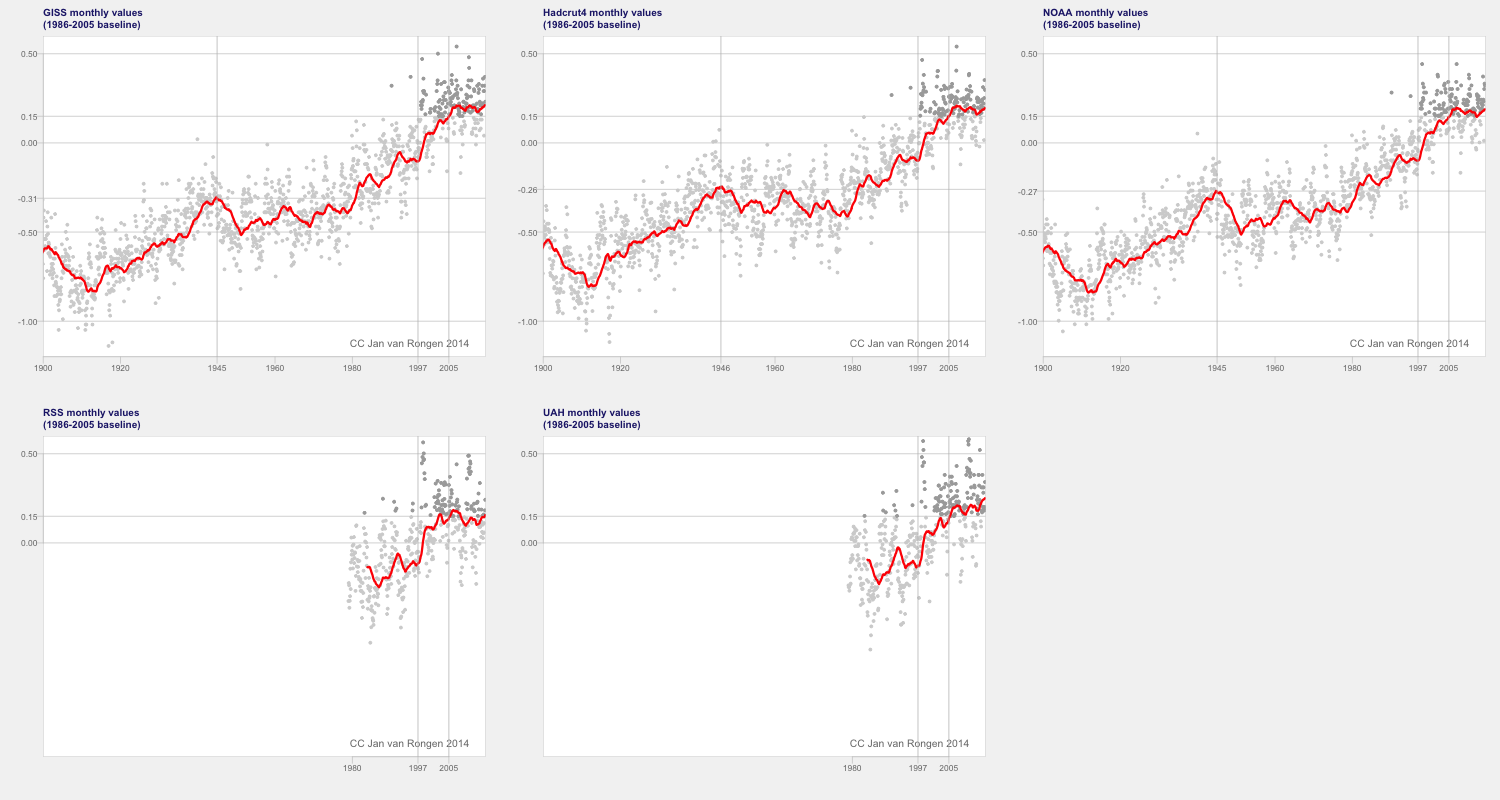
Enlarging this picture makes it easier to see that it the 1940’s maximum really falls in 1945, so it is better to shift the roling mean to the right. That also has the advantage that no future values are used. Before 1998 there are some outlier months (four to be precise) that have anomalies bigger than 0.68, but all other values above 0.68 fall after Jan. 1998. The rolling means take 7 more years to reach that value, but after 2005 it also stays above 0.68, permanently until today. We see the same pattern in all other temperature series (NB click to see the full size):