 The recent Typhoon Haiyan in the West Pacific that hit The Philippines had exceptional peak wind force, and an impressive overall windforce. Of course one starts wondering whether global warming has had any influence in this. Time for some analysis.
Data from all observations since 1945 until 2011 were downloaded from the Unisys Hurricane site. Some merging and cleaning up was needed. The data consists of a 6-hour snap shot of the location and (sustained) wind force of each hurricane.
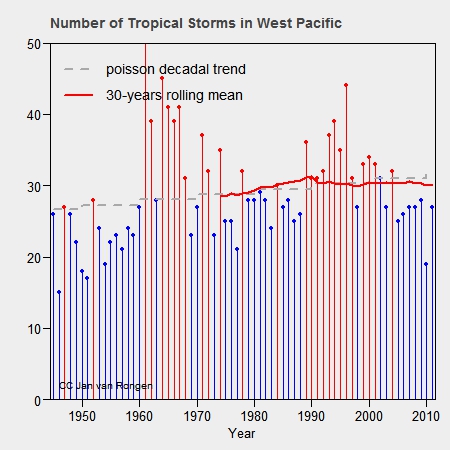
First lets have a look at the number of Tropical Storms in the area. It is a reasonable assumption that the number of storms can be modeled using a Poisson process: a poisson distribution with a parameter that chnges every year. Linearly regressing the lambda parameter against the decades gives the dotted line. It increases slightly, but the variance is rather large. We cannot conclude that global warming forces more hurricanes to appear in the West Pacific (p ~ 0.2).
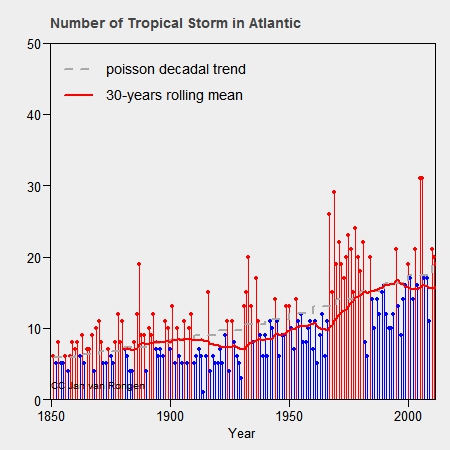
 Just for comparison here follows the same diagram for the Atlantic Ocean. That time series already starts in 1850, and clearly increases. However, the lower numbers for older years might indicate differences in the method of observation, rather than actual differences. Without further analysis we cannot infer much from this trend.
From the West Pacific data we derive the durations and the maximum intensity of the storms. We can formulate at least three variables that would give some more combined information:-
- the sum of the maxima of the storms in one year
- the sum of the duration of the storms in one year
- the sum of the mean wind force * durations
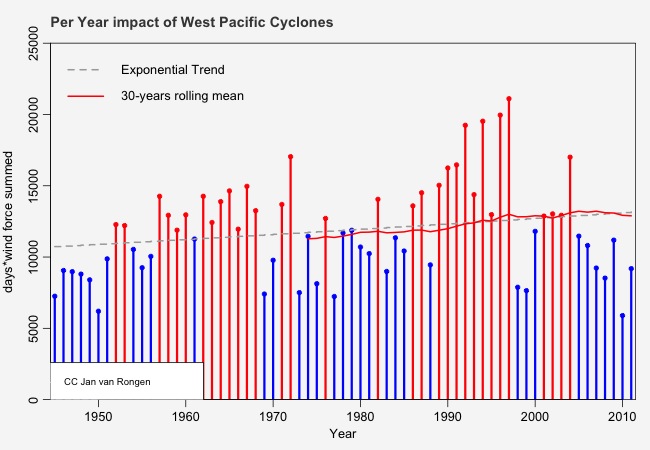
All three indicators show a small but significant increase. The last indicator seems to be the most accurate, it is shown below. It captures the three output parameters in one single indicator.
The regression now created has a very high accuracy, but one might question the model used. First: the increase is mainly caused by the duration of smaller storms, not by the big ones. Secondly, if we only take the last 30 years, there is a clear decline. And finally – the slope is small.
NB: data and code will follow.

